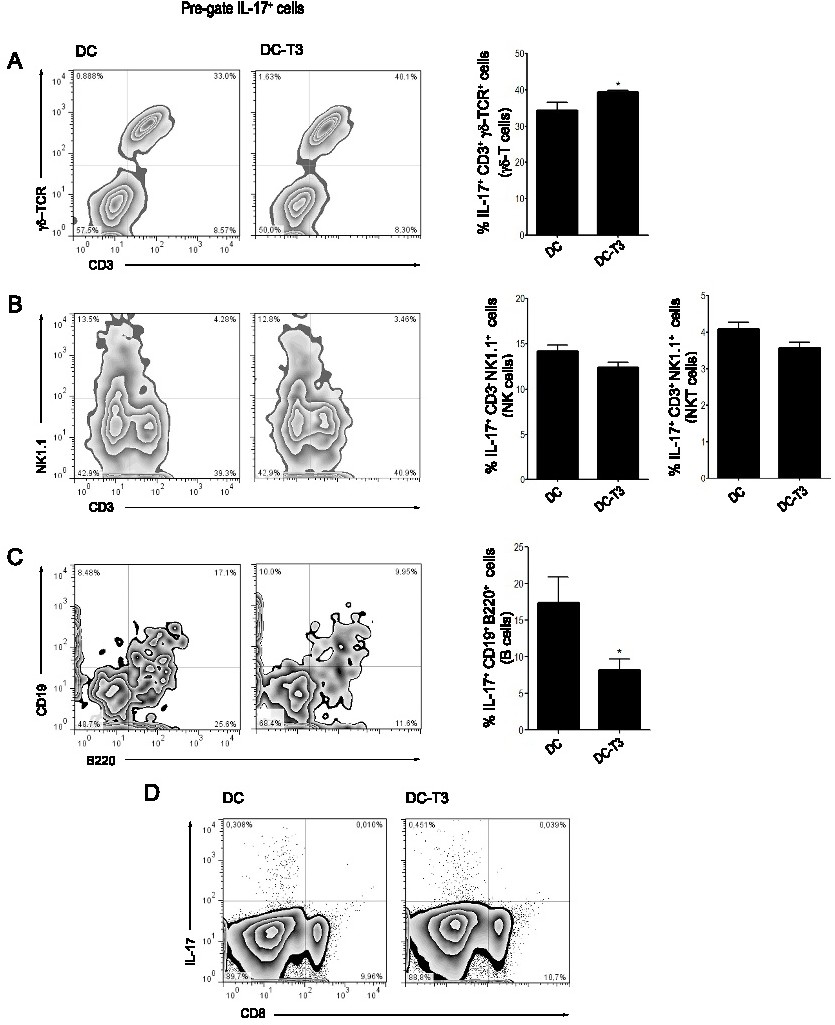
Fig. 3. Characterization of the IL-17-producing CD4- population. DCs were stimulated with T3 (5 nM, DC-T3) for 18 h or left untreated (DC) and then cultured with allogenic splenocytes for 3 days. The characterization of cell populations was determined by their specific markers by flow cytometry. gd-T cells (CD3+, gd-TCR+), NK cells (CD3-, NK 1.1+), NKT cells (CD3+, NK 1.1+), B cells (CD19+, B220+) and CD8+ T cells (CD8+). Representative density plots of gd-T, NK, NKT and B cell subsets analysis are gated on IL-17 producing CD4- T cells (left A, B and C, respectively). Comparative analysis of frequency of IL-17 expressing gd-T, NK, NKT and B cells (right A, B and C, respectively). (D) Analysis of IL-17-producing CD8+ T cells. Results are expressed as mean ± SD from a representative experiment of 3 with similar results performed in triplicate. *p<0.05 vs. DC.